
In this article 6 sections
Fabric data agents let you chat with your data, but the answers always came back as text. People kept asking me whether they could create charts and graphs with a data agent, and I always had to tell them no, unfortunately: for that you need Power BI. A new preview feature changes that, and the agent can now draw the visual right there in the chat.
I tried it on my TaxiAnalysis agent, the one from my post on optimising data agents, which queries the Gold lakehouse and the Taxi_Data_Agent semantic model. If data agents are new to you, start with the introduction.
Start with a plain question
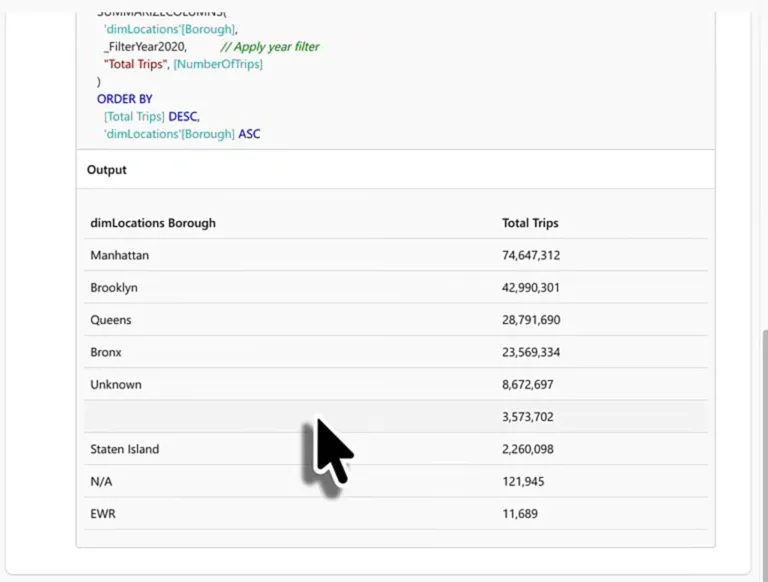
First a normal question: “Give me the list of boroughs with the most taxi trips in the year 2020.” I don’t need to open Power BI, browse the semantic model or write Spark SQL against the lakehouse for this. I can just ask the agent.
The agent rephrases it for itself as “List the boroughs ranked by total number of taxi trips for the year 2020” and analyses the Taxi_Data_Agent semantic model. Fifteen seconds later it answers with a ranked list (Manhattan by a wide margin, then Brooklyn, Queens, the Bronx and Staten Island) and a few lines of context.
Open the completed step and you see the DAX it ran:
// Boroughs ranked by total number of taxi trips for calendar year 2020
DEFINE
  // Year 2020 filter for the CalendarYear column in dimDates
  VAR _FilterYear2020 =
    TREATAS(
      { 2020 },
      'dimDates'[CalendarYear]
    )

EVALUATE
  SUMMARIZECOLUMNS(
    'dimLocations'[Borough],
    _FilterYear2020,          // Apply year filter
    "Total Trips", [NumberOfTrips]
  )
  ORDER BY
    [Total Trips] DESC,
    'dimLocations'[Borough] ASC
Below the code is the result set of that query, and the agent turns it into the answer you read in the chat, like you’re used to. Manhattan is by far the biggest and EWR by far the smallest. EWR could even be a rounding error, for all I know.
Ask for a chart
A ranked list is fine, but it isn’t very visual. So I asked for a bar chart representing these numbers.
The agent analyses the data source again and comes back with a chart titled “Total Taxi Trips by Borough (2020)”, with a short summary above it. Between the two it notes that a file, report_specs_1.json, was generated as a result of the query.
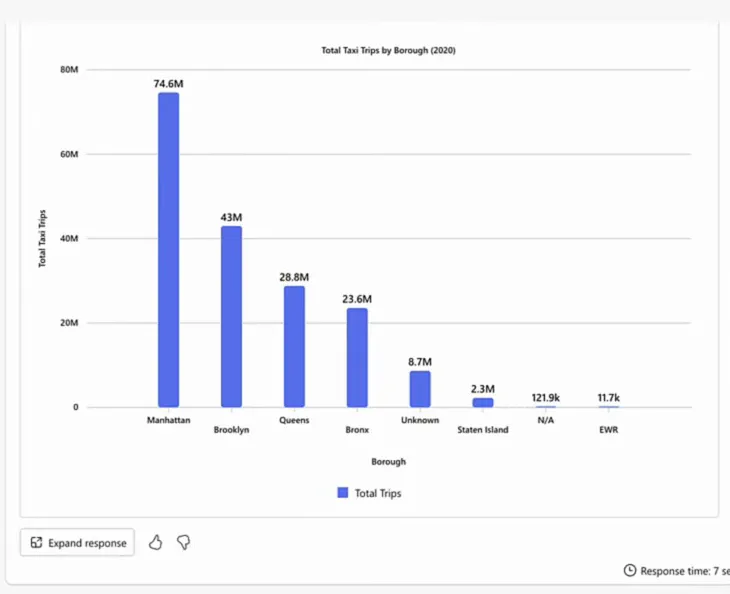
If I’m going to be very nitpicky: what it drew is a column chart. A bar chart has horizontal bars.
Bar charts are not supported
So I told the agent: “This seems to be a column chart (useful for time series) and I wanted a bar chart (for categories).” It agreed that for categorical data like boroughs, a bar chart with horizontal bars is easier to read and compare, and said it would make one. Then, in its next message, it found out that a bar chart isn’t directly supported by the current visualisation tool. Only vertical column charts are available for comparing categories.
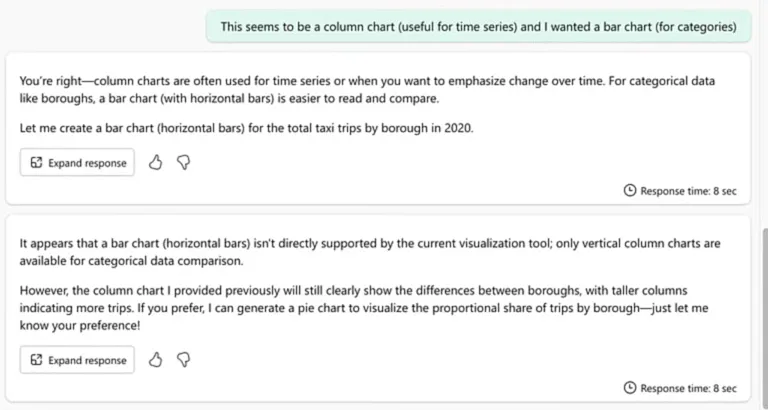
That matches the documentation. Microsoft’s page on visual responses from a data agent lists the visual types that are currently supported:
- Line chart
- Multi-line chart
- Column chart
- Multi-column chart
- Stacked column chart
- Pie chart
- Scatter plot
- Area chart
- Stacked area chart
There is no bar chart on that list. So when you ask for one, the agent reasons along the lines of: the user wants a bar chart, I don’t have one, so I’ll make a column chart because that’s the closest thing I have.
The same page explains that agent instructions can guide how the agent uses visuals, for example to always include a visual for certain types of questions, or to prefer specific chart types for certain data patterns. Visuals are on by default, and the instructions are also where you tell the agent to stop generating them. The colours, font sizes, title and labels are preset and currently can’t be customised.
Now look at the end of the agent’s reply again. If I prefer, it can generate a pie chart to show each borough’s share of the trips. Pie charts are on the list, so yes, you can have one.
Pie charts are allowed by Microsoft. They are not allowed by me.
I am against pie charts. Do not use them. Use bar charts instead.
Year-over-year growth as a line chart
The next question was harder: “What is the year over year growth in taxi trips, visualised in a line chart?” I was hoping to get the growth for each year, rather than the trip counts by year.
The agent rewrites it as “Show the total number of taxi trips by year and compute the year-over-year growth in trips. Provide results for each year, and prepare data for a line chart visualization.” Then it analyses the semantic model again.
The agent writes its own measures
To answer the question, the agent comes up with new measures on the fly: total trips, trips in the prior year, the change, and the change as a percentage.
// Yearly total trips and year-over-year growth, ready for line chart visualization
DEFINE
  // Total trips per current filter context (year)
  MEASURE 'factTaxiTrips_aggregate'[Total Trips] =
    [NumberOfTrips]

  // Trips in the prior year (based on the dimDates[Date] relationship)
  MEASURE 'factTaxiTrips_aggregate'[Trips PY] =
    CALCULATE(
      [Total Trips],
      SAMEPERIODLASTYEAR('dimDates'[Date])
    )

  // Absolute year-over-year change in trips
  MEASURE 'factTaxiTrips_aggregate'[Trips YoY Change] =
    [Total Trips] - [Trips PY]

  // Percentage year-over-year growth in trips
  MEASURE 'factTaxiTrips_aggregate'[Trips YoY %] =
    DIVIDE(
      [Trips YoY Change],
      [Trips PY]
    )

EVALUATE
  SUMMARIZECOLUMNS(
    'dimDates'[CalendarYear],
    "Total Trips",      [Total Trips],
    "Trips PY",         [Trips PY],
    "Trips YoY Change", [Trips YoY Change],
    "Trips YoY %",      [Trips YoY %]
  )
I’m kind of impressed that it writes DAX measures to answer a question.
One line is flat
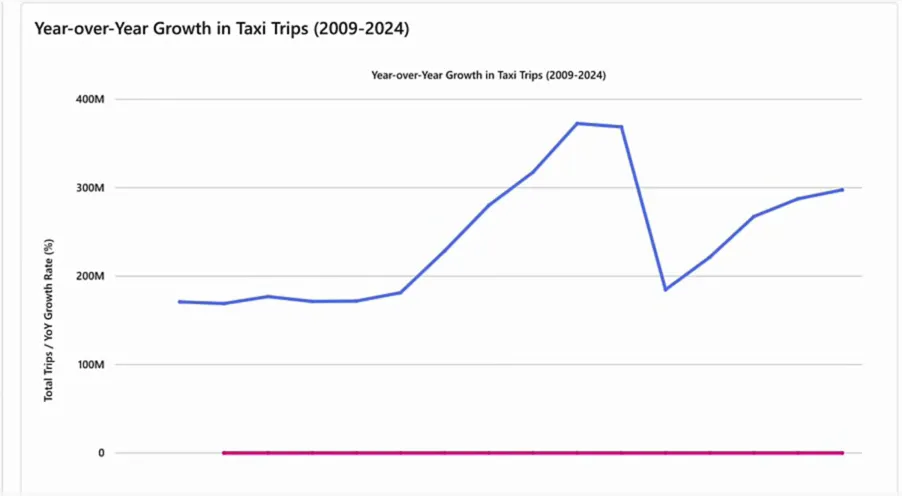
The answer is a line chart titled “Year-over-Year Growth in Taxi Trips (2009-2024)” with two lines on the same axis: total trips and the year-over-year percentage. The text above it even points out the sharp decline in 2020, which the agent puts down to the pandemic.
The chart itself doesn’t help me much, though. The total trips run into the hundreds of millions, the year-over-year growth is a small percentage, and on one shared axis that leaves the growth line flat at zero.
Ask again, typos and all
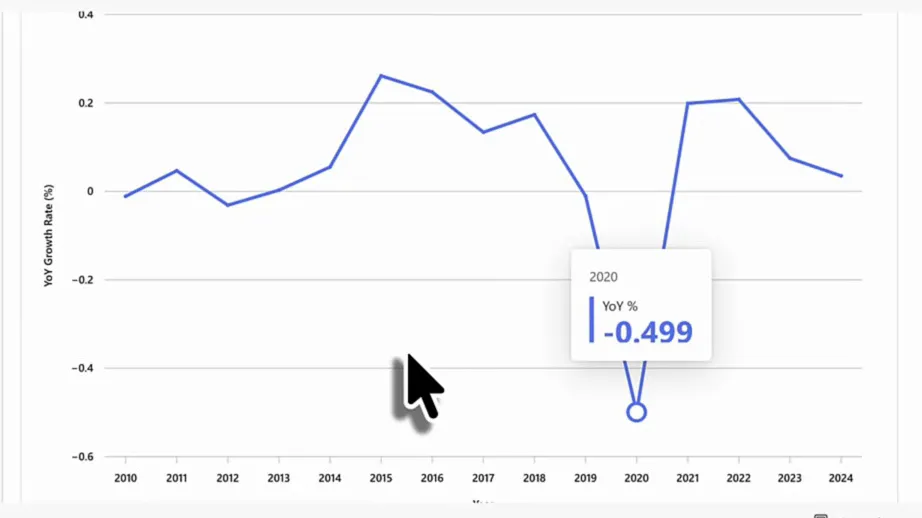
So I followed up with “Give me jsut the YoY% not the absolute numbers.” Don’t mind the typo: the agent should understand it, and it does. This time the chart, “Year-over-Year Growth Rate in Taxi Trips (2010-2024)”, shows only the growth rate per year, and now it is actually useful. The dip in 2020 jumps out straight away, and hovering over it shows -0.499.
Why I want visuals
So you can now ask the agent to visualise your data as well as answer questions about it. I don’t know about you, but for me visualisations make data analysis a lot easier. I’m always happy when I get a visual instead of a piece of text that I need to interpret myself. Visuals are a big, big improvement in what Fabric data agents give you back.
On my wishlist: export to Power BI
There is one thing I’d like to have: exporting a visual into a Power BI report. Say you want to build a report that answers the questions you’ve been asking the data agent. Then there should be a button next to the visual that says “create new Power BI report including this visualisation”. The semantic model the data agent runs on already exists, so that should be possible, and it would be amazing.
I really hope that is coming. I have no idea, though, and as far as I know it’s not on the roadmap.
Until then, check the DAX behind each answer, ask for a chart type that is actually on Microsoft’s list, and when the first chart doesn’t help, tell the agent what you’d rather see. My follow-up worked fine, typo included.
