
In this article 8 sections
Can a coding agent build a decent dashboard on its own? And if it can, should it build a Power BI report or a Fabric app? I gave Claude Code the same brief twice, at the same time and on the same semantic model: one agent built a Power BI report, the other a Fabric app with Rayfin. Both got a single screenshot of a dashboard I found online as their design reference, and from there I mostly kept my hands off.
Both came back with a usable first draft, and both spent a surprising amount of their time testing their own work. The Fabric app looked better, though. For someone who has been working with Power BI since before it was GA, that is hard to admit.
Setting up the contest
Both sides start from the Gold_TaxiData semantic model in my ThatFabricGuy workspace, built on the New York City taxi data I like to use in my demos. For Power BI, I created a new report, chose Pick a published semantic model, selected Gold_TaxiData and created a blank report called Agentic_Contest_PBI. For the Fabric app, I created a new App (preview) item called Agentic_Contest_App and let Fabric deploy it. (If you haven’t built one before, my first Rayfin post walks through it.)
The design reference is a generic web dashboard with KPI cards, a profit trend, a day-of-week bar chart, a gauge and a table of best-selling products. I wouldn’t call it the nicest dashboard I’ve seen, but it has a lot of design elements that I think are rather difficult to create in Power BI, and I wanted to see how Claude Code would deal with those.
Each agent ran in its own Claude Code window on Claude Opus 5.5, with the effort on extra high and auto mode on, so this was definitely some heavy lifting. Both worked in one project folder with a power-bi and a fabric-app subfolder. The prompts were short, but I had put a lot of context in the project’s CLAUDE.md, and the Fabric app folder has its own INSTRUCTIONS.md. This was the Power BI prompt:
Use the subfolder power-bi to create a Power BI report that uses the semantic model and publish the pbir definitions to Power BI, trying to create a dashboard following the instructions and CLAUDE.md file. Directly publish the Power BI report to the portal, do not ask me everytime. Use the existing Power BI report Agentic_Contest_PBI in the workspace ThatFabricGuy.On the Fabric app side, I first had Claude scaffold the Rayfin project with the prompt from the app’s getting started page. Then came the actual brief:
After scaffolding the Rayfin app, please start working on the data app. It must be a dashboard, connected to the semantic model, layout accoridng the CLAUDE.md and instructions and using the sample report. Let's go! You are allowed to do anything on this project you'd like. Also, directly publish the app everytime you make changes. Do not ask me for permissions, just go.The scaffolding run already showed how closely the agent reads its context. It flagged that I asked for the blankapp template while INSTRUCTIONS.md asks for dataapp (it went with mine). It also found the Rayfin CLI signed in to the wrong tenant and asked me to run npx rayfin login for the right one. That was my first intervention.
The Power BI agent: skills and a strict validator
The Power BI agent started by asking to read outside the working directory. It wanted the Power BI report authoring skill in my user-level skills folder, and I allowed it. (The Power BI skills and the powerbi-report-author CLI they need come up in my Claude Code setup post.) It read the skill’s references on cards, cartesian visuals and filters, then the chart, table and theme templates, and used powerbi-report-author scaffold to create a minimal PBIP report project.
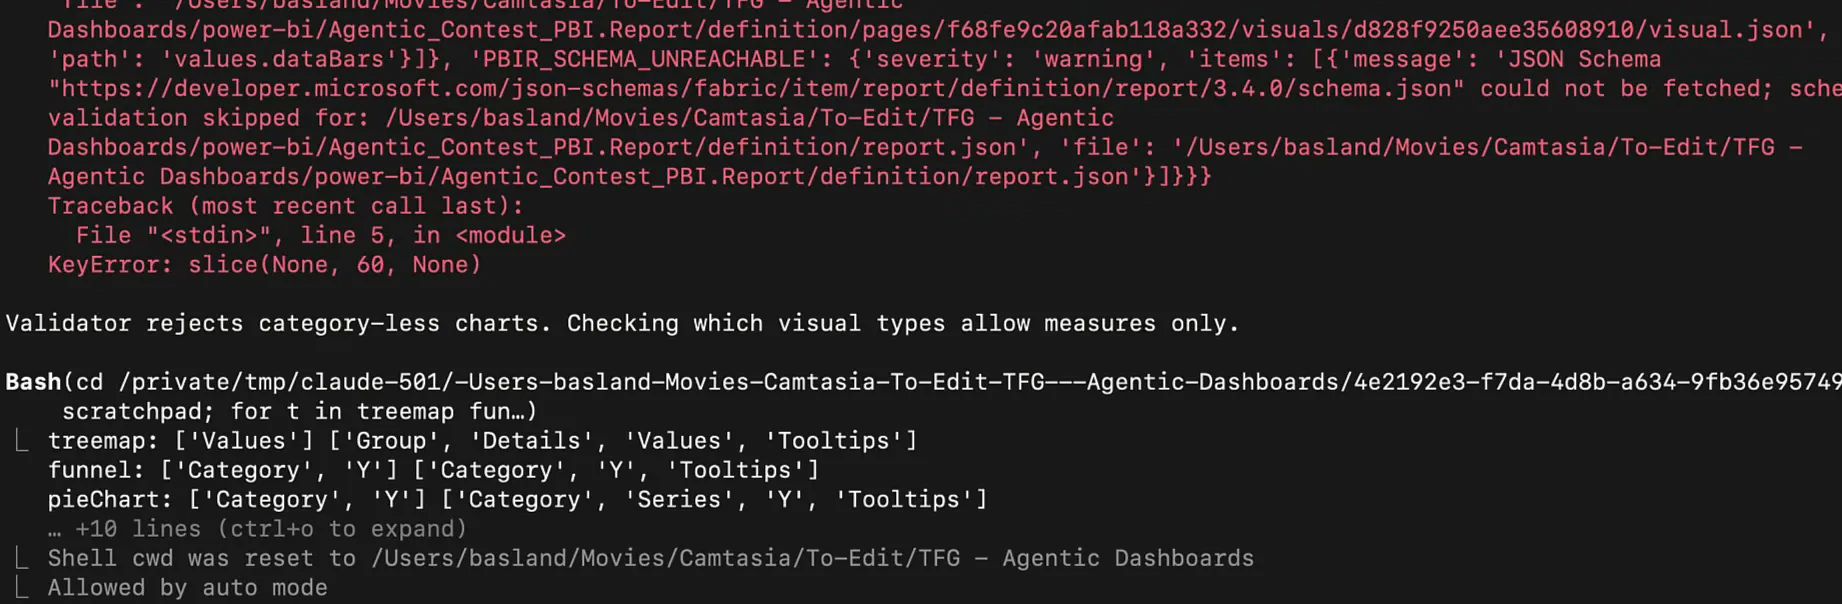
About eighteen minutes in, the terminal filled up with red errors. The validator rejected a whole list of formatting properties:
Unknown property "minCategoryWidth" in formatting object "layout" for clusteredColumnChart
Unknown property "shadeArea" in formatting object "lineStyles" for areaChart
Unknown property "dataBars" in formatting object "values" for pivotTable
It also refused charts without a category. I had no clue what was going on, but Claude worked it out on its own: “Validator rejects category-less charts. Checking which visual types allow measures only.” Later it found that numeric enums in the PBIR have to be written as 1D instead of '1', because the string form made the navigator invalid and invisible. It fixed all of them and rendered both pages locally in memory to check the result.
The Fabric app agent: DAX checks and a test browser
The Fabric app agent read the agent guidance that comes with the Rayfin template (AGENTS.md and the skills in .agents/skills/) and the Rayfin documentation. Then it validated its DAX queries against the model through the app’s connector: “Validation contexts recorded (March 2019: 33,849,618 trips, matches monthly query). Testing performance of heavier visual queries.”
At that point neither side had anything to show in the portal. The report was still empty, and the published app was still the blank template telling me to ask Copilot what to build. Sorry, Copilot. I’m in love with Claude Code.
Then Chrome opened, and at first I didn’t know why. The banner said it was being controlled by automated test software: Claude had opened the published app in a browser it controls and was waiting for me to sign in (my second intervention). After that it clicked through the pages and filters, made changes and checked the app in phone view, regular view and dark mode, all really fast. It has to test on the published app, because according to the Rayfin docs npm run dev doesn’t run semantic model queries.
For a good part of the run, both agents were validating like this. When I peeked at the published Power BI report, I saw clipped text, and a refresh later it looked mostly fixed. That’s what I find really cool about agentic development. The model is multimodal, so it can look at what it built, see what’s wrong and fix it, which means that when you get the notification that it’s done, it probably is done.
First look at the Power BI report
My first reaction was “Oh wow, okay. This is not bad for a first iteration.” I wouldn’t be mad seeing this.
The report has two pages, Taxi Operations Overview and Trip Patterns Explorer, with a filter panel for borough, zone, taxi type and pickup dates, plus model notes on what the semantic model can’t answer.
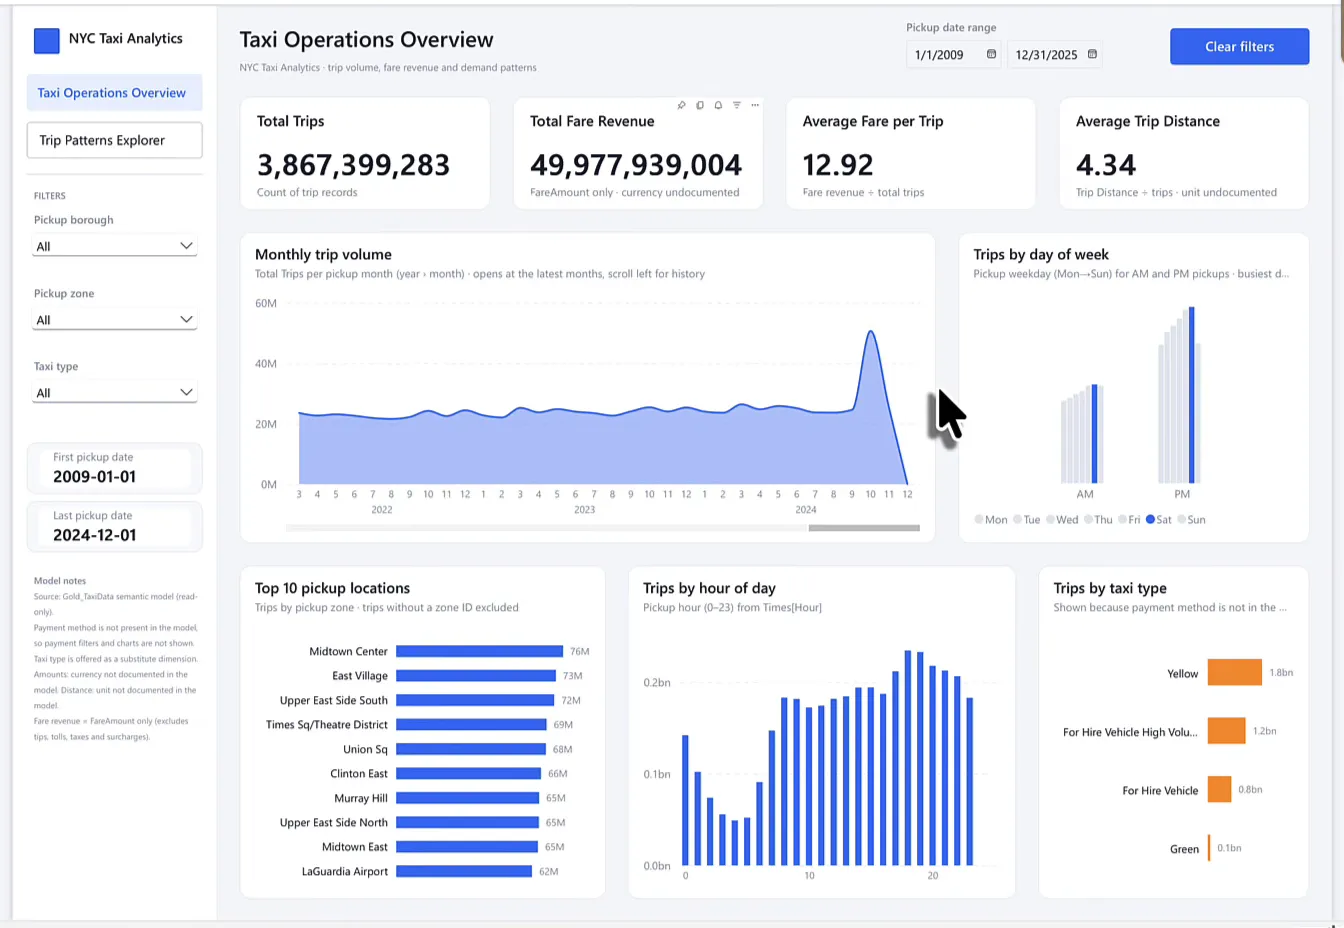
There are some visual quirks, such as some clipped text and large numbers that could have been rounded (total fare revenue shows as 49,977,939,004). The heat map on the second page is a bit busy, but it does show the hotspots: around 8:00 in the morning and 6:00 in the evening on weekdays, and more at night on Saturday and Sunday, which I guess makes sense for people going out. It needs cleaning, of course, but I’m not too worried about that. As a first version, this is something I could work with.
First look at the Fabric app
The Fabric app agent finished first. The whole run took about 64 minutes, and the first published app with real data was there at about 46 minutes. It didn’t build into Agentic_Contest_App: that item wasn’t created by this run, so Claude left it alone and published a new app called NYC Taxi - Fabric Data App, the name my CLAUDE.md asks for. I never told it to use the existing one, so I can’t be too picky about that.
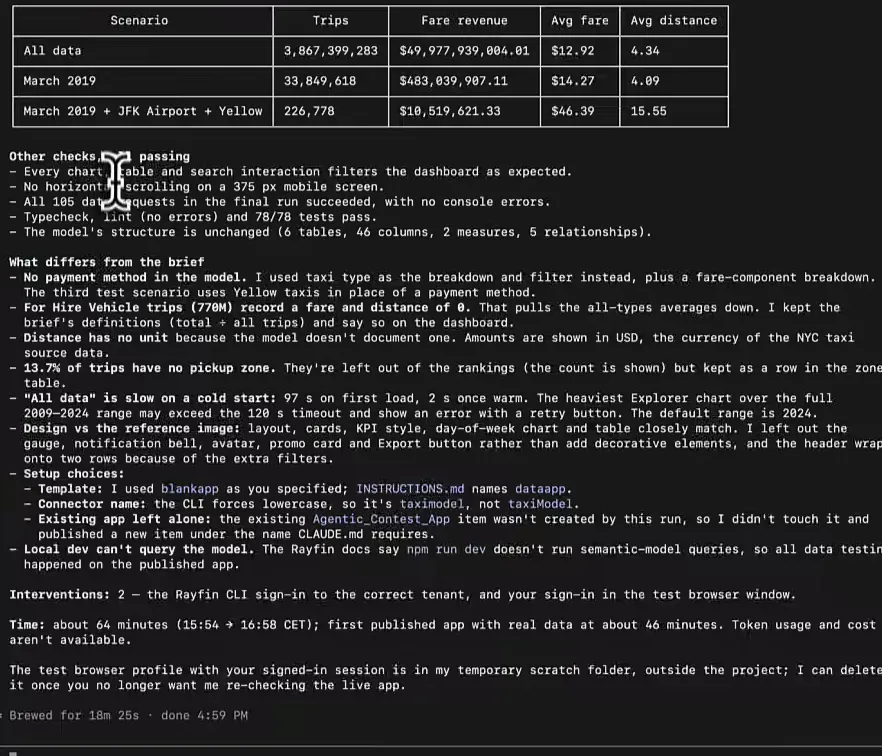
Its run report shows how it checked its work. The numbers in the live app matched direct queries on the model for three scenarios, every interaction filtered as expected, nothing scrolled sideways on a 375 px phone screen and all 78 tests passed. It also listed where it deviated from the brief. There’s no payment method in the model, so it used taxi type instead, and loading all data takes 97 seconds on a cold start, so the default date range is 2024.
The app itself is pretty good. It’s interactive just like Power BI, with KPI cards compared to the same period last year and an About this data card that explains the gaps in the model.
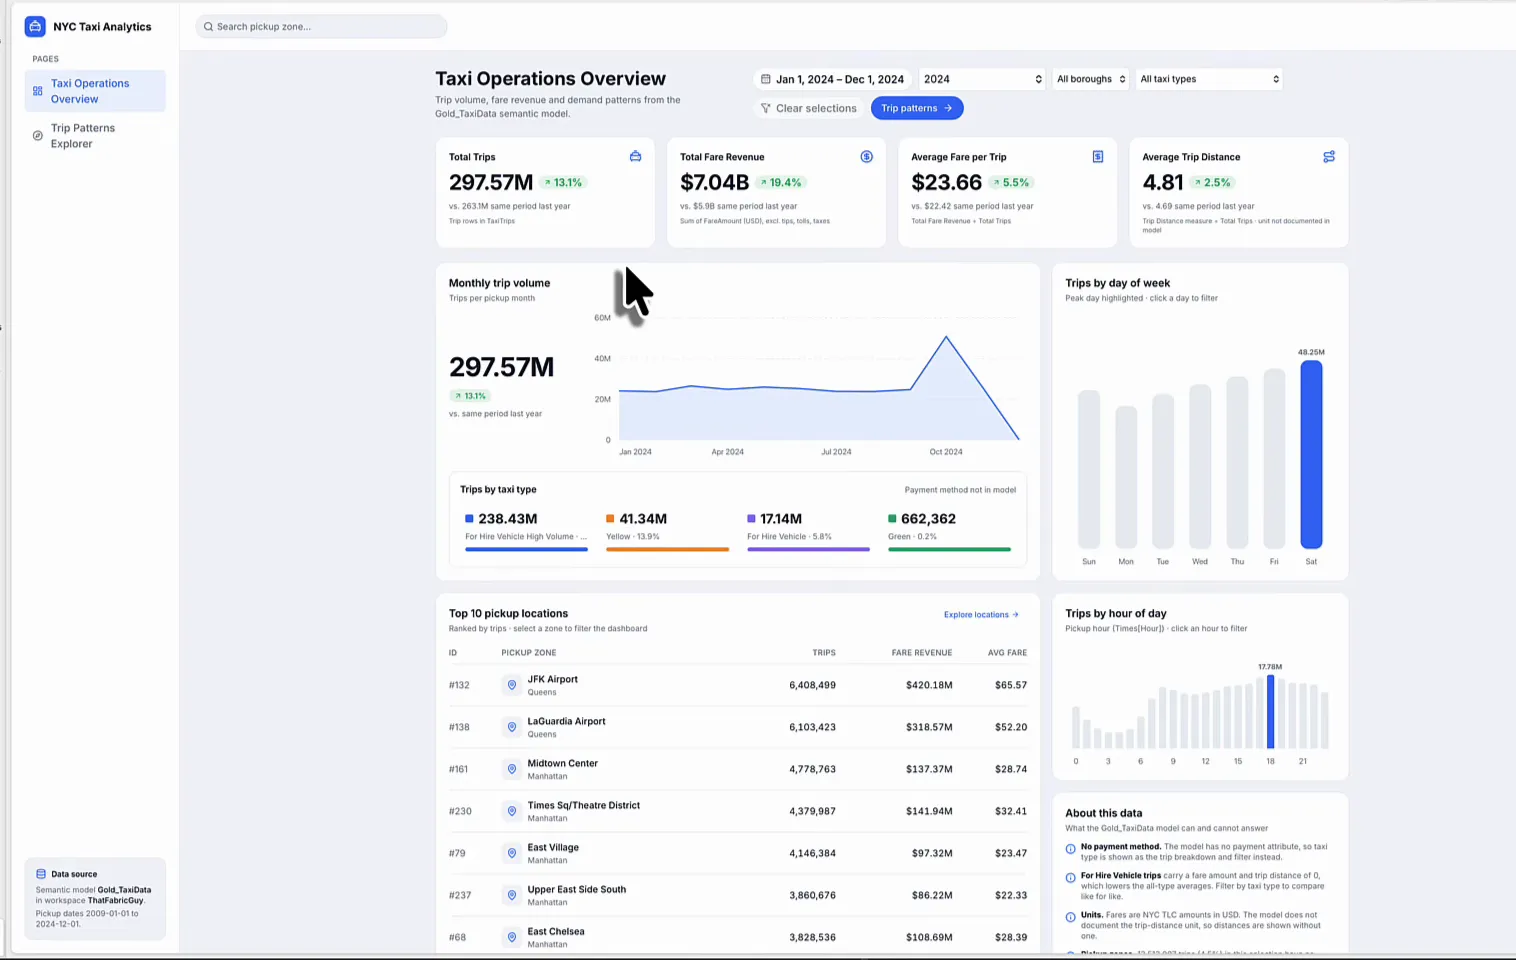
It’s a bit slow, but the data set is large (close to 3.9 billion trips), so I’m not angry about that. I filtered to Manhattan and yellow taxis, and the app shows the active filters at the top and keeps them when I switch pages. When I click a zone such as Midtown North, I get its trips over time and its location details. I have to scroll vertically, but this is a pretty cool dashboard.
Side by side
The Power BI agent finished a while later, and the final report kept the same two pages.
| Power BI report | Fabric app | |
|---|---|---|
| Look | Matched the colours of the reference | Layout, cards and KPI style close to the reference |
| Numbers | Large unrounded numbers | Rounded (297.57M, $7.04B) |
| Density | Numbers floating around, white space inside charts | Dense, highlights what you need to see |
| Self-testing | PBIR validator, local render, published report | DAX checks, browser tests in phone view and dark mode |
The Power BI report matched the colours, but layout-wise I would definitely prefer the Fabric app. It’s a bit nicer in look and feel, it’s clearer, and it understood that these numbers need rounding.
What one run cost
While the agents were running, I wondered what all this would cost. These are the Claude Code session numbers, priced at API rates:
| Power BI report agent | Fabric app agent (Rayfin) | |
|---|---|---|
| Total cost | $12.65 | $16.67 |
| Duration (API) | 28m 13s | 33m 41s |
| Duration (wall) | 1h 21m 38s | 1h 21m 38s |
| Code changes | 1,163 lines added, 15 removed | 2,838 lines added, 3 removed |
On a Claude subscription plan you don’t pay these amounts per run. Either way, compare it with my own time. Building a dashboard like this by hand would have taken me hours and hours, and my time is expensive. I’d rather let AI do the labour-intensive report building while I work on the hard parts of a project.
Fabric apps win this round
I couldn’t have built either of these first drafts this fast manually, and apart from one permission prompt and two sign-ins, I didn’t interfere. From here I can take screenshots and ask the agents to change things. As a first version I do like the Power BI one, a little. But I like the Fabric app more. It’s just cleaner.
I’m a Power BI guy, and I hate to say it, but I’m considering using Fabric apps more and more.
I gave it just one image for design, and it executed almost flawlessly. If I add design rules and a proper rule book to the context, this could get really cool. For today, though, there’s a very clear winner, and that’s Fabric apps.
